In 2017, video content is becoming ever more central to how people consume media. According to research by HighQ, this year around 30% of smartphone users will watch video content on their device at least once a day. In addition to this, people will spend on average an extra two minutes browsing sites that feature video content compared with sites that do not. For this reason, video content is an important component of driving up revenues for online news publishers, since keeping your audience on your site allows you to sell more ads.
But even though we can find great market research on consumer behavior around video content, we couldn’t find an answer to the following question — what type of video content is the news industry publishing to capitalize on this? For example, how much video content is actually being published? Are some publishers dominating video content? And are some subjects being supplemented with videos more regularly than others? Knowing this would allow us to understand what areas of the online news industry are set to flourish in the coming years with the growing emphasis on video.
We decided to use the News API to look into this question. Last month, our API crawled, analyzed, and indexed 1,344,947 stories as they were published. One of the metadata points that it analyzed was how many images and videos were embedded on the page. So for this blog, we’ll analyze the 1.3 million stories our News API gathered in July to find answers to the following questions:
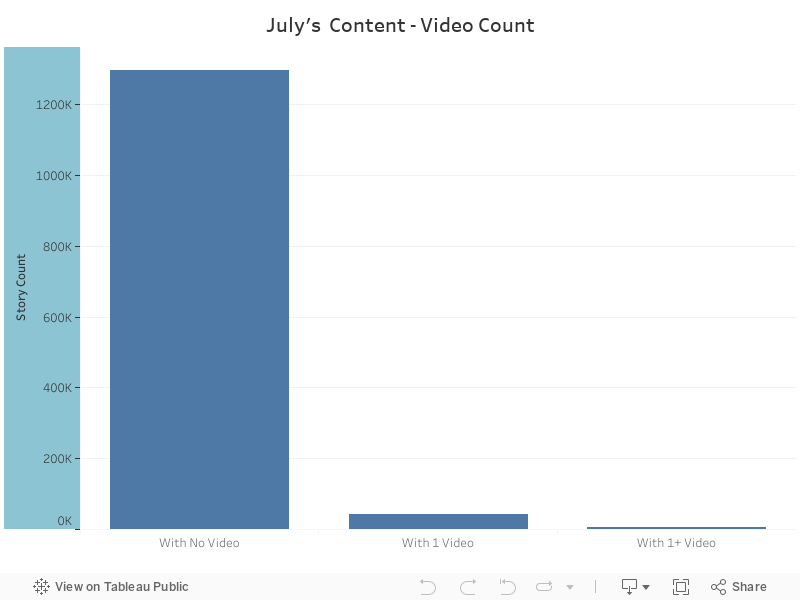 As you can see, 96% of stories published last month did not contain any video content, whereas just under 4% contained one video or more. We found this interesting — while HighQ found that almost 30% of smartphone users will watch video content online at least once per day, we can see here that barely 3.5% of news content published last month contained a video. This isn’t really optimal for an industry that relies on clicks for ad revenue.
But let’s focus on the news stories that contained video content. If we knew what these stories were about, we would have a good idea about what areas of online news are likely to fare well, since these areas likely account for a large proportion of ad revenue, and are therefore likely to grow. To look into this, we decided to try to understand what the stories containing video content were about.
As you can see, 96% of stories published last month did not contain any video content, whereas just under 4% contained one video or more. We found this interesting — while HighQ found that almost 30% of smartphone users will watch video content online at least once per day, we can see here that barely 3.5% of news content published last month contained a video. This isn’t really optimal for an industry that relies on clicks for ad revenue.
But let’s focus on the news stories that contained video content. If we knew what these stories were about, we would have a good idea about what areas of online news are likely to fare well, since these areas likely account for a large proportion of ad revenue, and are therefore likely to grow. To look into this, we decided to try to understand what the stories containing video content were about.
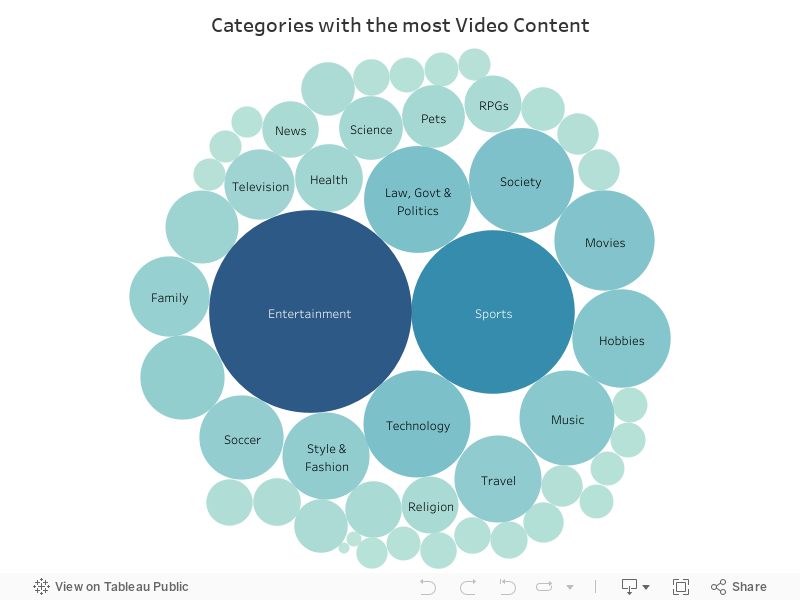 You can see that the Entertainment category had the most stories with video content accompanying them. This isn’t surprising to us at first, as we have all seen articles about celebrities with annoying videos that play automatically. But if you remember last month’s media roundup, you’ll remember that the Sports and Law, Government, and Politics categories produced by far the highest volumes of content (the Sports category alone published over double the content of the Entertainment category). This means that not only are there more videos about entertainment, but also that stories about entertainment are much more likely to contain a video than stories about politics.
So now we know which subject categories video content appeared in the most. But with the News API, we can go one step further and see exactly what people were talking about in the stories that contained a video. To do this, we used the Trends endpoint again to extract the entities mentioned the titles of these stories. Take a look at the chart below to see what people were talking about:
You can see that the Entertainment category had the most stories with video content accompanying them. This isn’t surprising to us at first, as we have all seen articles about celebrities with annoying videos that play automatically. But if you remember last month’s media roundup, you’ll remember that the Sports and Law, Government, and Politics categories produced by far the highest volumes of content (the Sports category alone published over double the content of the Entertainment category). This means that not only are there more videos about entertainment, but also that stories about entertainment are much more likely to contain a video than stories about politics.
So now we know which subject categories video content appeared in the most. But with the News API, we can go one step further and see exactly what people were talking about in the stories that contained a video. To do this, we used the Trends endpoint again to extract the entities mentioned the titles of these stories. Take a look at the chart below to see what people were talking about:
 Here you can see exactly what the stories containing videos were about. The single biggest subject that was accompanied by a video was Love Island, a reality TV show. But you can also see that large soccer clubs are well represented on the chart. If you think back to last month’s roundup again, you’ll remember the huge reach and popularity of the top soccer clubs, even during their off-season. The chart above shows that these large soccer clubs are also being covered more with video content than other entities, with publishers obviously trying to leverage this reach to attract people to the stories they publish.
With large soccer clubs dominating both regular news content and video news content, and with ad revenues for video content being so valuable, these soccer clubs look like they have a bright future in terms of media content. Since the clubs benefit financially from media coverage through things like player image rights and viewership of games, large transfer fees like the $263 million PSG are going to pay for Neymar don’t look so crazy.
Here you can see exactly what the stories containing videos were about. The single biggest subject that was accompanied by a video was Love Island, a reality TV show. But you can also see that large soccer clubs are well represented on the chart. If you think back to last month’s roundup again, you’ll remember the huge reach and popularity of the top soccer clubs, even during their off-season. The chart above shows that these large soccer clubs are also being covered more with video content than other entities, with publishers obviously trying to leverage this reach to attract people to the stories they publish.
With large soccer clubs dominating both regular news content and video news content, and with ad revenues for video content being so valuable, these soccer clubs look like they have a bright future in terms of media content. Since the clubs benefit financially from media coverage through things like player image rights and viewership of games, large transfer fees like the $263 million PSG are going to pay for Neymar don’t look so crazy.
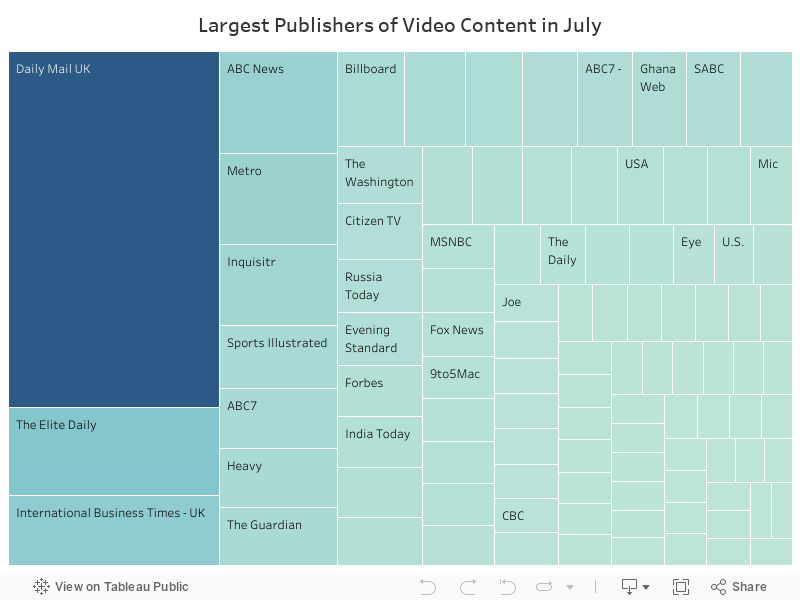 The Daily Mail obviously dominate the chart here, which isn’t too surprising when you consider that they feature video as a central part of the content on their site. They produce a huge amount of stories every month, and feature video even when it wasn’t completely related to the story it appeared with. Although the discontinuity can seem odd, even a loosely-related video can increase click through rate and revenues.
As you can see, many traditional news publishers are lagging behind in terms of the amount of video they’re publishing, with The Guardian, Forbes, ABC, and The Daily Mail among the few recognizable print and television giants on the graph. Instead, the field is largely made up of publishers like The Elite Daily, Uproxx, and Heavy, digital native organizations who are publishing more online video content than most traditional publishers.
Well, that concludes our brief analysis of last month’s video content in news stories. If you’re an AYLIEN subscriber, we’d like to remind you that the two endpoints we used in this post (Trends and Time Series) do not return stories, so you can hit them as much as you like and they won’t contribute towards your monthly 10,000 stories. So dig in!
If you’re not a subscriber, you can try the News API free of charge for two weeks by clicking on the image below (free means free, there’s no card required or obligation to buy).
The Daily Mail obviously dominate the chart here, which isn’t too surprising when you consider that they feature video as a central part of the content on their site. They produce a huge amount of stories every month, and feature video even when it wasn’t completely related to the story it appeared with. Although the discontinuity can seem odd, even a loosely-related video can increase click through rate and revenues.
As you can see, many traditional news publishers are lagging behind in terms of the amount of video they’re publishing, with The Guardian, Forbes, ABC, and The Daily Mail among the few recognizable print and television giants on the graph. Instead, the field is largely made up of publishers like The Elite Daily, Uproxx, and Heavy, digital native organizations who are publishing more online video content than most traditional publishers.
Well, that concludes our brief analysis of last month’s video content in news stories. If you’re an AYLIEN subscriber, we’d like to remind you that the two endpoints we used in this post (Trends and Time Series) do not return stories, so you can hit them as much as you like and they won’t contribute towards your monthly 10,000 stories. So dig in!
If you’re not a subscriber, you can try the News API free of charge for two weeks by clicking on the image below (free means free, there’s no card required or obligation to buy).

- How many of the stories published last month featured video content?
- What were the stories with video content about?
- Which news organizations published the most video content?
1. How many stories published last month contained video content?
To get an idea of how far the video medium has spread into the online news industry, we need to find how much video content was used by news publishers last month. To do this, we used the News API’s Time Series endpoint to sort the stories published in July according to how many videos they contained. We then visualized the results to show how many stories contained no videos, how many contained one video, and how many contained more than one. Take a look below at what we found:2. What were the stories containing video about?
Knowing that only around one out of every thirty stories contained video content last month is interesting, but it begs the question of what these stories were about. To answer this question, we used the Trends endpoint to analyze the 43,134 stories that contained one video and see what subjects each one was about. One of the pieces of information our News API extracts is topics that are discussed in the story, and which categories the story fits into, based on two taxonomies. For this visualization, we’ll use the advertising industry’s IAB-QAG taxonomy. Take a look below at which categories contained the most video content:3. Who were the biggest publishers of video content?
As we mentioned in the introduction, we want to find out which publishers are making the quickest transition to video-based content, as this has a knock-on effect on site viewership, and therefore ad revenues. Knowing which players are leading industry trends like this is a good indicator of which ones are going to survive in an industry that is under financial pressure while transitioning to digital. With that in mind, we used the Trends endpoint to find out which publishers were leading the way in video content. You can see pretty clearly from the graph below that the Daily Mail dominates last month’s video content. To see the rest of the publishers more clearly, you can select the Daily Mail bubble below and click “exclude”.
Related Content
-
 General
20 Aug, 2024
The advantage of monitoring long tail international sources for operational risk

Keith Doyle
4 Min Read
-
General
16 Feb, 2024
Why AI-powered news data is a crucial component for GRC platforms

Ross Hamer
4 Min Read
-
General
24 Oct, 2023
Introducing Quantexa News Intelligence
Ross Hamer
5 Min Read
Stay Informed
From time to time, we would like to contact you about our products and services via email.