The COVID-19 pandemic has dominated news headlines so far in 2020 and rightly so as it has impacted our lives in ways never seen before. The virus has caused mass societal disruption and brought economies to a standstill, yet environmental commentators have stated that there has been one major benefactor amidst this crisis - the earth.
Experts have stated that emissions have fallen sharply worldwide. In China, carbon emissions dropped 18% while in the European Union, declining power demands and depressed manufacturing could cause emissions to fall by nearly 400 million metric tons this year. Climate activists have noted such reductions and called for continued reductions in the future.
Tracking Natural Disaster Events
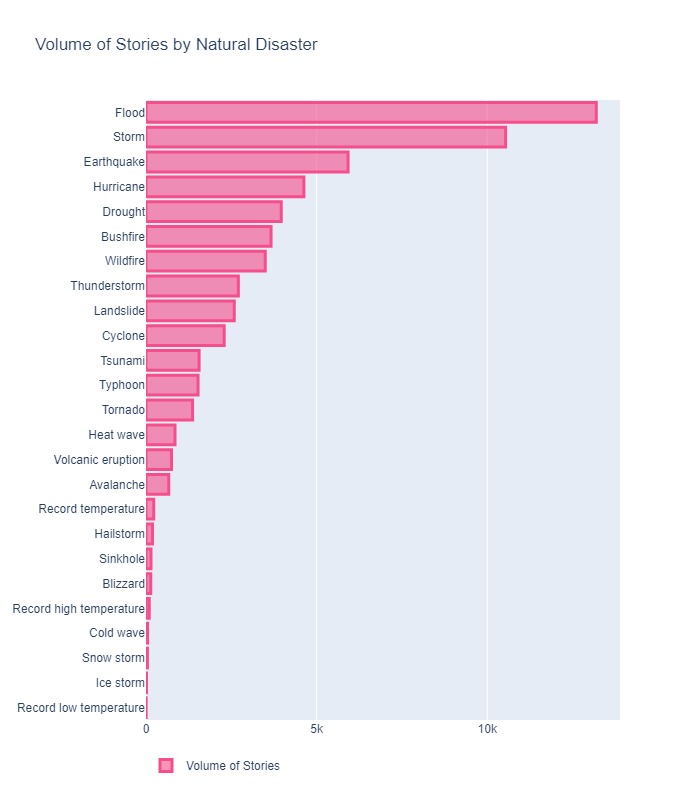
However, the topic of climate change and natural disasters has been sidelined by COVID-19 and with this in mind, we were curious to investigate the prevalence of natural disasters throughout the world. We looked at the period of May to December 2019 and searched for all article titles that mentioned a natural disaster keyword e.g. flood, cyclone, volcanic eruption. We grouped these keywords into the following categories inspired by the elements:
- Hot: Heat wave, Drought, Record high temperature, Wildfire, Bushfire
- Cold: Blizzard, Cold wave, Record low temperature, Ice storm, Snow storm, Hailstorm, Polar Vortex
- Wind: Storm, Thunderstorm, Cyclone, Typhoon, Tornado, Hurricane
- Floods: Flood, Tsunami
- Earthquakes & Other: Avalanche, Landslide, Earthquake, Sinkhole, Volcanic eruption, Limnic Eruption, Solar flare
We also wanted to focus on significant natural disaster events. Using AYLIEN’s categories enrichment, we targeted only stories that were classified as "disasters or accidents" to weed out lower impact, weather related events. Finally, we utilized our entity enrichment to identify the locations where the stories occurred so that we could plot them on a time lapse map.
Pause the time lapse map below and hover over data points to read their respective article titles.
We see clusters of purple focused on the Middle East, where a series of earthquakes shook the region while the west coast of the US and Australia frequently see yellow events relating wildfires and droughts. Meanwhile Europe, India and the east coast of the US frequently see high volumes of news reporting storms and floods.
Identifying Events Using News Cluster Technology
Needless to say, many of these news stories could be reporting on the same event, so we were keen to aggregate these stories and see what the biggest events were. We used our clustering enrichment to identify the biggest news clusters relating to natural disasters.
We plotted these clusters on a scatter plot according to size. It is quickly apparent that Hurricane Dorian was the biggest natural disaster news story of H2 2019. It is interesting to note that our technology differentiated between two clusters for Dorian - one cluster relating to the destruction caused in the Bahamas and the other focusing on Florida. Other significant events included Hurricane Barry, flood destruction in Venice and uncontrollable wildfires in Australia. Hover over the clusters to view the representative article title for each cluster.
Free Natural Disasters Dataset
We have collated a free data set for public usage relating to Natural Disaster events. Similar to the time lapse map above, this data set was generated by searching for news stories that mention natural disaster event keywords and that were categorized as "disaster or accident".
Download the data set here.
Data set details:
- Size: 0.5GB (~34,000 news articles)
- Language: English content only
- Timeframe: May 2019 - Dec 2019
- Total Distinct Sources: 141

Related Content
-
 General
20 Aug, 2024
The advantage of monitoring long tail international sources for operational risk

Keith Doyle
4 Min Read
-
 General
16 Feb, 2024
Why AI-powered news data is a crucial component for GRC platforms

Ross Hamer
4 Min Read
-
 General
24 Oct, 2023
Introducing Quantexa News Intelligence

Ross Hamer
5 Min Read
Stay Informed
From time to time, we would like to contact you about our products and services via email.

